Normal 0 false false false EN-US X-NONE X-NONE /* Style Definitions */ table.MsoNormalTable {mso-style-name:”Table Normal”; mso-tstyle-rowband-size:0; mso-tstyle-colband-size:0; mso-style-noshow:yes; mso-style-priority:99; mso-style-qformat:yes; mso-style-parent:””; mso-padding-alt:0in 5.4pt 0in 5.4pt; mso-para-margin-top:0in; mso-para-margin-right:0in; mso-para-margin-bottom:10.0pt; mso-para-margin-left:0in; line-height:115%; mso-pagination:widow-orphan; font-size:11.0pt; font-family:”Calibri”,”sans-serif”; mso-ascii-font-family:Calibri; mso-ascii-theme-font:minor-latin; mso-hansi-font-family:Calibri; mso-hansi-theme-font:minor-latin;}
(Léelo en español en YV Polis)
It’s been more than 100 days since the inauguration of Nicolas Maduro. This period, typically known as the “presidential honeymoon”, usually means strong and stable approval ratings. However, looking at the thirteen polls I have collected since Maduro has been at the helm of the country, we can see that his honeymoon has been bittersweet.
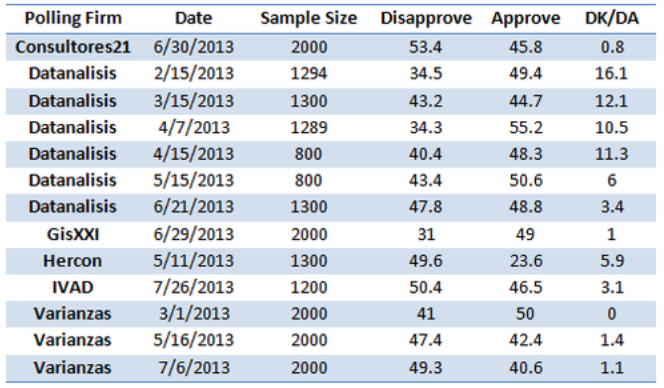
Table 1 Maduro polling, February – July 2013
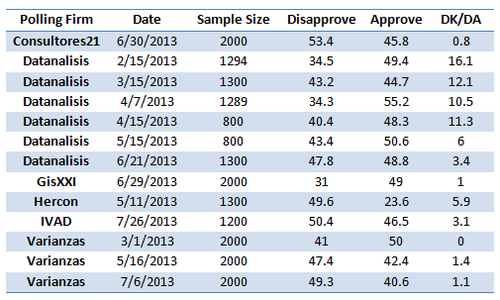
In this analysis I calculate, for each poll, the number of days since the presidential inauguration. To achieve an acceptable sample size I included polls carried out before the election when Maduro was functioning as acting president.
With this data (Table 1) I first carry out two graphical analyses: a first evaluates positive views on Maduro’s presidency (Figure 1); a second evaluates negative views (Figure 2). Figures 1 and 2 show the values for presidential approval (in green dots) and a linear prediction based on the number of days since inauguration (the grey shadow is the 95% confidence interval).
Figure 1 Maduro job approval

Table 2 Maduro Job disapproval
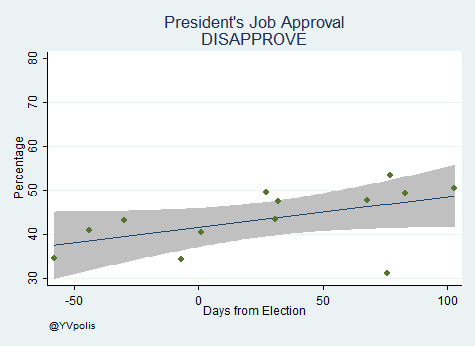
It is interesting to note in these figures two behaviors: 1) positive evaluations (Figure 1) remain relatively stable, while 2) negative evaluations (Figure 2) show a clear increase. In other words, the data shows that as days go by there is an increase in the number of people dissatisfied, however, this increase does not seem to be related to a reduction in those who support the government.
To test this hypothesis I move now to a statistical analysis employing a linear regression ( ordinary least squares or OLS) model to evaluate this relationship. This measure tests whether there is a significant correlation between two variables. Table 1 shows the results of three regressions:
A model that evaluates how the number of days affect positive approval.
A model that evaluates how the number of days affect negative perception.
A model that estimates how the number of days affect the undecided (DK/DA).
Table 2 OLS Regression of days versus job approval
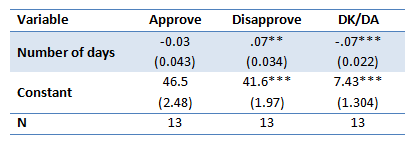
**p<.05, ***p<.01
Table 2 shows that the passing days of the presidency does not seem to impact positive evaluations. The coefficient of -0.03 although negative is not statistically different from zero. On average president Maduro has an approval of 46.5% and it seems to be stable at the moment. In contrast, however, his negative numbers are increasing with each day that passes by 0.07% (which in 100 days amounts to 7%). This increase comes, as column three shows, at the expense of those who don’t have an opinion (undecided), which explains why the positive numbers remain steady.
Thus we could say that President Maduro is enjoying half a honeymoon with a stable support (even though under 50%) on the one hand, but increasing negative numbers on the other. And this latter tendency has started to eat away the undecided. These results beg the question of what will happen in the upcoming municipal elections. Will Maduro’s positives start slipping? Or will they remain stable? If the latter is true then the government might not fare as bad as the opposition is hoping.
Iñaki Sagarzazu is a Lecturer in Comparative Politics at the University of Glasgow and author of the blog YV Polis (http://yvpolis.blogspot.com).