We have made a correction to this article. A reader over at Caracas Chronicles (check on the discussion here) found an error in Figure 9 which affects the record of pollsters in the 2010 election. However, it does not affect the mean errors used to calculate the three different scenarios in Table 2.
On October 7 Venezuelans will choose their president for the next six years: Hugo Chávez or Henrique Capriles Radonski. As the race has been fully described by other authors in this blog, I am not going to delve into the characteristics of the candidates, their strategies or how they got to where they are. Instead I will focus on one of the main causes of uncertainty in this election: the polls!
In this race, I’ve tried to find the reasons behind the large variance between pollsters (which can be as much as 30 points), moving beyond facile distinctions between “serious” and “briefcase” pollsters. As such, I have relied on what historical data I have been able to amass and as many current polls as possible, to determine overall bias in polls (for all of this and more you can visit my blog YV Polis). In this article I will present an analysis of the bias for and against the government and the opposition in five races for which I have several surveys (64 in total): The 2004 recall referendum, the 2006 presidential election, the 2007 and 2009 constitutional reform referendums, and the 2010 legislative elections. Let’s look at the numbers by election.
2004 Recall Referendum
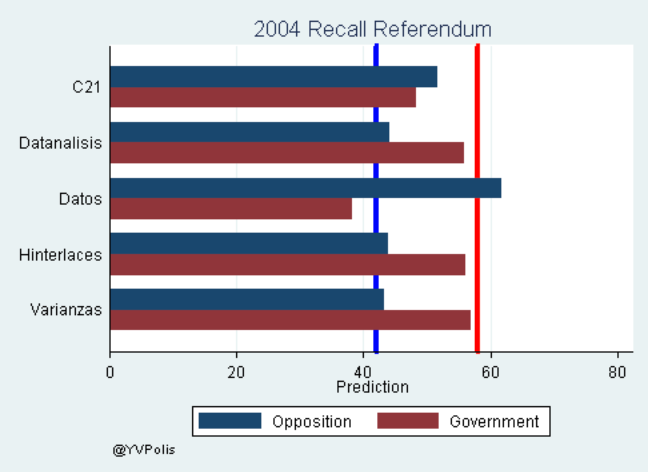
Figure 1 represents the last poll carried out by each of the polling firms for the 2004 referendum. With the blue horizontal bar representing the predicted outcome for the opposition option (YES) and the red horizontal bar the predicted outcome for the government option (NO). The two vertical lines represent the actual results of the election. When we look at Figure 1 it becomes clear that three pollsters predicted with relative accuracy the results of the election: Datanalisis, Hinterlaces, and Varianzas. Two pollsters, on the other hand, wrongly predicted that the opposition would win; Datos actually had an inverted outcome, while Consultores 21 had a statistical tie between the two options.
Figure 1. Last polls before 2004 referendum
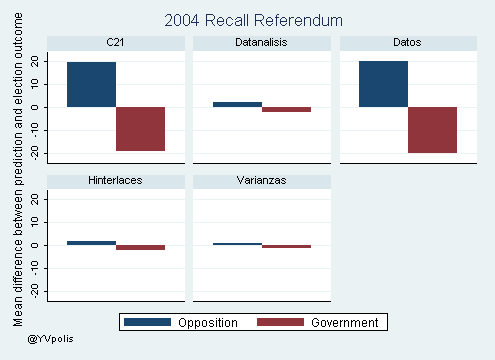
This result is repeated when we look at the pro-government or pro-opposition bias. In Figure 2 I include all the surveys of the different firms during the 2004 recall race and plot the mean difference between the real outcome and the predicted outcomes. As can be seen, both Consultores 21 and Datos have large biases in favor of the opposition while the other three pollsters show very little bias.
Figure 2. Mean bias for government and opposition in 2004 polls
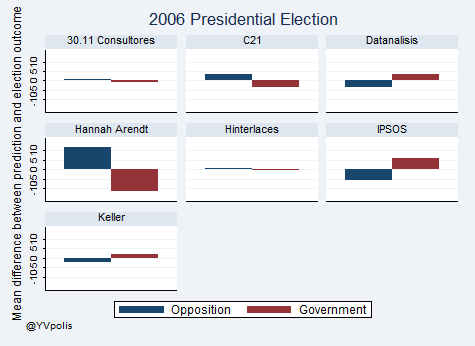
2006 Presidential Election
As a starting point to this analysis I have to say that I do not think the 2006 presidential election surprised anyone. Throughout the race most analysts thought Chávez would cruise to victory over Manuel Rosales. Nonetheless there were always rumors about hidden votes and the “spiral of silence” that might make the difference for a Rosales win. Having said this, I do not think the following two graphs show any surprising findings. Most pollsters were relatively accurate in their estimates, for instance, Consultores 21 showed less than a 5% bias in favor of the opposition. The only poll in my dataset that exhibited a large bias in favor of the opposition was the one carried out by the Hannah Arendt Observatory, which used the three color pencils method to predict the winner, based on the spiral of silence theory. Utilizing this method, respondents were split into three groups and each group got a different color pencil to vote (colors were red, yellow, and blue). The observatory found that people voting with a blue pen disproportionately voted in favor of Rosales, while those voting with a red pen did so overwhelmingly in favor of Chávez.
Figure 3. Last polls before 2006 election
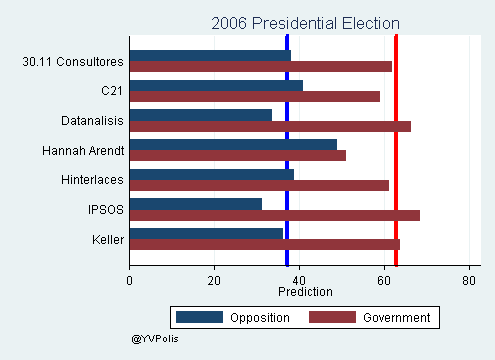
Figure 4. Mean bias for government and opposition in 2006 polls
2007 Constitutional Referendum
The 2007 referendum is interesting because the race was so close. It is also the race in which we start noticing more and more non-traditional pollsters with large pro-government biases. Three polling firms managed to get the results of the election right based on their last poll: Consultores 21, Datanalisis and Hinterlaces. Three pollsters, on the other hand, managed to provide analyses that were many points off of the actual election results: 30.11 Consultores, IVAD and Keller.
Figure 5. Last polls before 2007 election
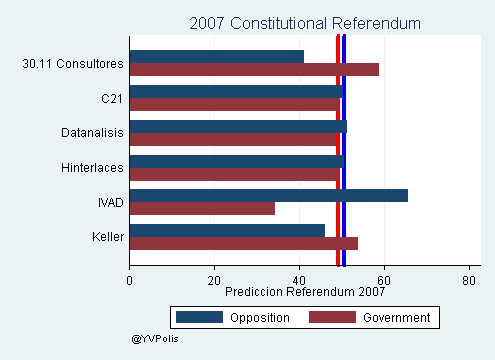
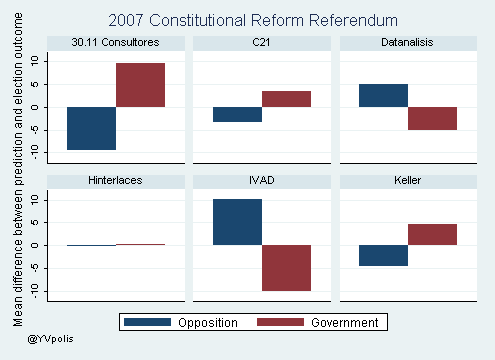
Figure 5 shows the last poll available and how it compares to the actual election result. When we average out all the different polls and their biases we see some slight changes (figure 6). In line with the previous graph we see large average biases for the government by Consultores 30.11, and for the opposition by IVAD. We see medium biases of 5 points for Datanalisis (pro-opposition) and Keller (pro-government). And we see small biases in the case of Consultores 21 and Hinterlaces. These differences are partly due to the changing nature of the race, which became closer as election day neared.
Figure 6. Mean bias for government and opposition in 2007 polls
2009 Constitutional Reform Referendum
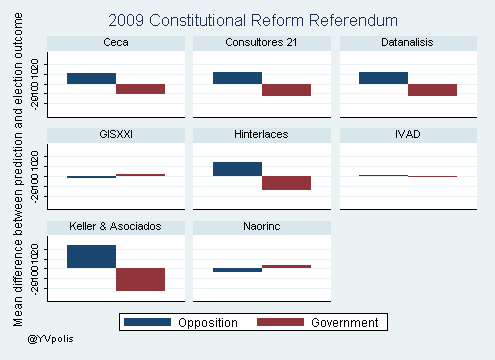
Finding polls for the 2009 referendum was challenging. I was only able to obtain verifiable and reliable data for 5 polls: 3 for Datanalisis and 2 for Hinterlaces. Given the importance of this election I used a data set which would not meet normal academic standards: the Wikipedia article on the 2009 referendum. From it I obtained information for 23 polls from 8 different firms. However, of these I was only able to confirm two; the other links are not active. The last poll available for each firm is shown in Figure 7. As it can be seen there was a big bias in favor of the opposition. From these 23 polls I estimated a mean bias for each firm’s polls, which you can see below in Figure 8. As can be seen Keller and Hinterlaces have the largest biases in favor of the opposition, and, in general, it seems that most pollsters erred on the opposition’s side. Interestingly, IVAD and GISXXI, two pollsters that typically have high errors, this time where quite accurate.
Figure 7. Last poll before 2009 election
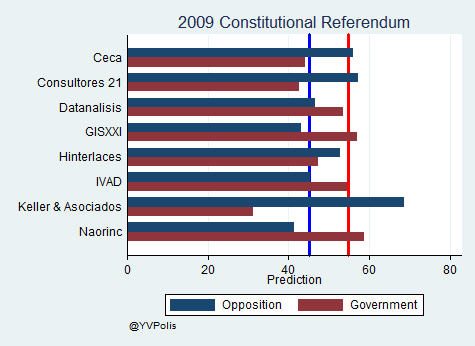
Figure 8. Mean bias for government and opposition in 2009 polls
2010 Legislative election
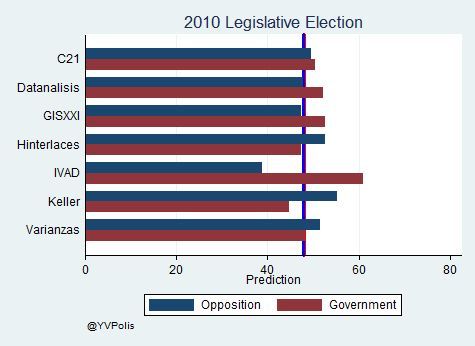
The last election Venezuelans participated in, before the current presidential race, was the 2010 Legislative election. This, like the 2007 election, was a very close contest—at least in terms of vote percentages. The final difference in votes between the government and the opposition was very difficult to predict and (as can be seen in figure 9) only one pollster was able to get close to it with its last poll: Consultores 21. Consultores 21 was followed closely by Varianzas and Datanalisis who were also followed closely by Hinterlaces and GISXXI. On the other side of Hinterlaces we have IVAD, which over-predicted the pro-government votes and under-predicted the opposition votes by almost 10%.
Figure 9. Last prediction before 2010 election
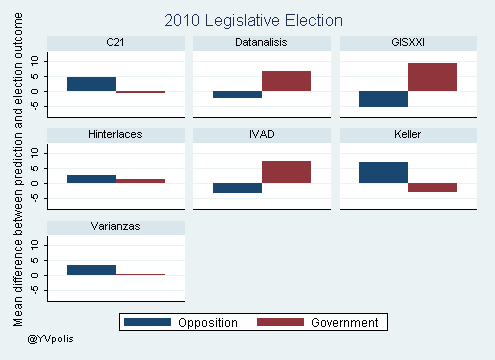
While the last poll provides interesting results, looking at the average biases for the whole race gives a more complete picture. In Figure 10 we can see that three pollsters had a pro-government bias of medium to large size (more than 5%); these are Datanalisis, GISXXI and IVAD. One pollster, Keller, had a medium bias in favor of the opposition, and the other three had small pro-opposition biases; these are Consultores 21, Hinterlaces, and Varianzas.
Figure 10. Mean bias for government and opposition in 2010 polls
The 2012 Race
Now what does all this mean? It means that polling houses err, typically favoring the same side—although there is some variation. In the following table we can see the average error that each pollster made in each election, in favor of the government (top row) and in favor of the opposition (bottom row). Positive numbers means they over-predicted and negative numbers mean they under-predicted. For instance, Datanalisis has made mistakes both in favor of the government (2006, 2010) and in favor of the opposition (2004, 2007); this is the same with IVAD who has made large errors but on different sides. Others are more consistent in who they err in favor of. For instance, Consultores 21 tends to favor the opposition. There is one last pollster (about which I have little firsthand knowledge) that has been very consistent in having low biases. This pollster, Varianzas, has made mistakes that are well within the margin of error of their polls. However, I only have surveys from them for two electoral events. The final column estimates the average error for each polling firm over the five elections included in this analysis.
Table 1. Mean error by polling house for each election
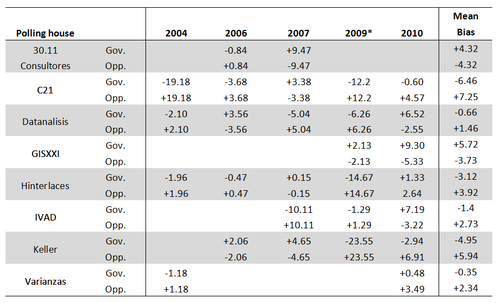
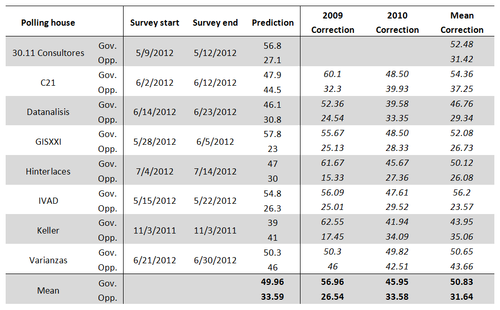
Table 2 shows the last poll by each of the firms for the current race. It includes the start and end dates of the survey and the current prediction. I added three columns with what I call “corrected” predictions. Two of these predictions are based on different electoral dynamics. In the first, the opposition is thought to be ahead but ends up losing (like in 2004 and 2009); this uses the error from 2009 to generate a correction. In the second, the government is thought to be ahead and the opposition ends up winning or coming very close (like in 2007 and 2010); it uses the error made in 2010 as a correcting factor. Finally there is an average scenario that uses the mean error to correct the prediction made by each polling house.
The final row provides an average of all polls and of all of the corrections. The three corrected scenarios point to where the race could end based on current polling, if each of the different dynamics takes place. So, for instance, if the election has a dynamic similar to 2009 then it would end similar to the presidential election in 2006 with a Chávez landslide. If, on the other hand, the race dynamic is like the 2010 and 2007 elections then undecided voters will be a major player; according to this dynamic the difference between Chávez and Capriles would shrink to 12 points, with Chávez well below the 50% mark. Using the correction based on the errors of all five electoral events shows Chávez with a 19 point margin.
Table 2. Last prediction available, by polling house, for the 2012 race and correction based on alternative race dynamics
I am more inclined toward corrected scenario number 2, pointing to a 46-34 race since it is consistent with other analyses I have carried-out. In addition, the opposition’s current unity and clear strategy would seem to make the current election more similar to the 2007 and 2010 elections than the 2004 and 2009 referenda when the opposition campaigns languished.
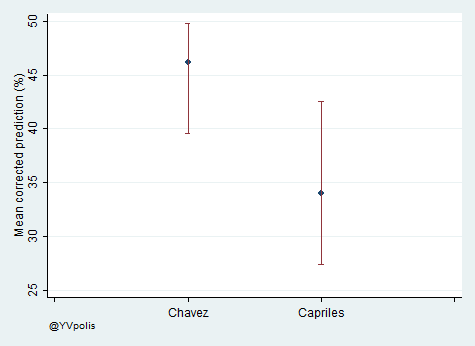
The 2010 correction shows a race where Chávez holds the lead, but by a margin smaller than the number of undecided voters. The direction these latter take could significantly alter the race. To see this more clearly take a look at one last graph. This graph shows the mean-corrected prediction from these 8 pollsters for both Chávez and Capriles. It also shows the maximum corrected value and the minimum corrected value for both. The way to interpret the graph is the following: Chávez is somewhere in the range of 39 to 49, with a mean of 46; Capriles is in the range of 27 to 43, with a mean of 34. These ranges have a five point overlap, which means that this race is still up for grabs, especially considering that most of these polls were carried out the month before the campaign officially started and people started tuning into the race.
Figure 11. Minimum-maximum range, and mean, of corrected prediction based on 2010 correction
Iñaki Sagarzazu is a Lecturer in Comparative Politics at the University of Glasgow and author of the blog YV Polis (http://yvpolis.blogspot.com).